Does Pokemon GO actually make people more physically active

Introduction

With the rise of technology, and rising obesity rates many people question whether or not there is a relation between the two. The largest risk groups in america for obesity are teenagers and young adults (Hallal et al., 2012), these are also the people who spend the most time on some kind of technology. Staying inside and not getting exercise is bad you your physical and mental health. Many companies are trying to get the people who play their games more active. The first approach was movement based games. Games that were played with your body instead of a controller, for example the Nintendo Wii or the Xbox Connect  (Tong, Gromala, Shaw, & Choo, 2016). More and more businesses came up new ideas and we ended with Pokemon GO, a game you play on your phone. , and the basic idea of Pokemon GO is that you’re a pokemon trainer trying to catch them all, and to catch Pokemon you have to walk in the real world. This lead to more people getting up and being physically active, but did it. “Pokemon GO and physical activity among college students. A study using Ecological Momentary Assessment” is a study done the original researchers by Oriol Marquet*, Claudia Alberico, Aaron J. Hipp asks thw questions: Are the people who play Pokemon GO more physically active because of it? That is what this study wanted to find out.

Process

The study was done on college kids in North Carolina. The average age was nineteen and a half, and the participants were asked whether they identify as a Pokemon GO player. Around half of the participants Identified as Pokemon GO players. Then the participants would download Pokemon GO and a pacer to track how many steps they took throughout the day. The researchers would look at how many steps you took before downloading Pokemon GO and after to see if there are any differences. The researchers would also monitor when they participants were playing Pokemon GO. This was to tell if the increased physical activity was really due to Pokemon GO or not. Then the participants would also complete a survey in what they did and if Pokémon GO affected there exercise routine.

Results

The results were inconclusive most people didn’t show any difference before and after downloading Pokemon GO. The people that identified themselves as Pokemon GO players did on average have a lot more steps than the non players. There was no difference in the genders as far as the researchers could tell. The researchers also tested whether or not a city or rural environment would affect how much a participant would play and of how long. Because Pokemon GO has feature where most attractive spots, such as tourist destinations and popular/historical sites would have rarer pokemon. Also the real world geography plays a role on what Pokemon appear for you. So people might walk longer to get to some water to find a water type. People who live in cities do tend to play longer and walk longer. Social players didn’t seem to have any difference than players that played alone. During the weekdays and between noon and seven at night, the people who said they play Pokemon GO actually had a increase in physical activity. The numbers overall didn’t show much improvement of people who said they didn’t play Pokemon GO, and the participants who were identified as players barely increased in physical activity.

Improvements

This experiment is not without some flaws. First there is no accounting for exercise outside of walking or running, swimming or lifting. It is also assuming that the participants have their phone on them every time they go out. They mention that instead a of a app an Actual pedometer would’ve worked better. That way they could get a much accurate idea of how much physical activity each participant was getting. The people they recruited were mostly people who had already played Pokemon GO. It would have been interesting to see if a person who had never played or heard of Pokemon GO, if it would have increased their physical activity or not.

Some things that the researchers need to remember about game like Pokemon GO to succeed. One is that it requires a large social and connected fanbase that play the game multiple time a week.A social group is necessary for this game not having friends who a game with you makes the game boring, and you will eventually stop playing.  Another counter arguments is that the only people who grew up playing pokemon will be interested in continually playing pokemon enough to get some positive change in their physical activity. Nintendo will also have to continually put out new updates. Once you collect all the Pokemon there is very little reason to continue playing, unless Nintendo releases new Pokemon every year. With over seven hundred Pokémon it should be able to last someone a few months, if not years. The game only have around three hundred different Pokemon in the game so far but Nintendo is planning on increasing that number and attract new player.

The Future

The next step for the this kind of research would be how to increase the effectiveness of these kinds of games. What kinds of improvement of changes in environment would help people play games like Pokemon GO. They should test other games that make you go outside and compare how effective they were at increasing physical activity. The next test should have multiple groups each playing a different game in some different environments. Maybe try a game that promotes running for example Zombie Run where you have to run away from Zombie attacks. See if increased intensity will have a longer impact and make people want to play longer or just encourage them to start exercising

While the study states that Pokemon GO can increase physical activity in young adults. Young adults who are at the highest risk of obesity have been locked up in their rooms playing videos games. Pokemon GO tried to help fix that. The researchers found “that on weekdays between noon and seven at night Pokemon GO did improve the amount of physical activity teenagers were getting” (3). Pokemon GO is not a perfect solution to the obesity problem in America; the activity is not intense enough to lose weight. But getting outside even a little more than normal and doing physical activity can greatly increase a person’s mental and physical health (Althoff et al., 2016; Gao, 2016; LeBlanc & Chaput, 2016). The researchers were questioning whether or not playing Pokemon GO would take time away from much more intensive and healthy physical activity such as sports, and working out.

Conclusion

In summary there are many positives to games like Pokemon GO it get people outside and active. But there were many problems the researchers overlooked that would need to be fix in the next survey. Many different mobile games are being developed because of the success of Pokemon GO. If this types of games get more popular it won’t end obesity, but it will the teenagers and young adults at least a little physically active which is good for both their physical and mental health.


Works Cited

Althoff, T., White, R. W., & Horvitz, E. (2016). Influence of Pokemon Go on physical

Activity: Study and implications. Journal of Medical Internet Research, 18(12),

e315. http://doi.org/10.2196/jmir.6759.

Hallal, P. C., Bauman, A. E., Heath, G. W., Kohl, H. W., Lee, I. M., & Pratt, M. (2012).

Physical activity: More of the same is not enough. The Lancet, 380(9838), 190e191. http://doi.org/10.1016/S0140-6736(12)61027-7.

Tong, X., Gromala, D., Shaw, C. D., & Choo, A. (2016). A field Study: Evaluating

gamification approaches for promoting physical activity with motivational

models of behavior changes. In M. Kurosu (Ed.), Human-computer interaction.

Novel user experiences (Vol. 9733, pp. 417e424). Springer. http://doi.org/10.

1007/978-3-319-39513-5.

Marquet, O., Alberico, C., & Hipp, A. J. (2018). Pokémon GO and physical activity

among college students. A study using Ecological Momentary Assessment.

Computers in Human Behavior,81, 215-222. doi:10.1016/j.chb.2017.12.028
Do People Know They’re Biased Against Skin Color?


Everyone wants to know about the racial bias against people of color, predominately black people. There are many studies that have tried to find if- that bias- is intentional or subconscious (implicit or explicit).


The problem is, these studies have not completely been accurate, or they were half done. They would test one idea, but not its counterpart. An example of this would be a study done by Dickter, Gagnon, Gyurowski, and Brewington in 2015. This study was meant to test if the familiarity with other racial groups was able to lower the bias for the attentional bias, the tendency for someone to pay more attention to some things while ignoring others. (Dickter, et al, 2015). But, while this study tested the attentional capture, they ability to catch someone’s attention, it did not test for attentional holding, the ability to catch someone’s attention and hold it for an amount of time (W. Finnegan, et al, 2018).


Also, the studies that were done showed bias in and of themselves. A study done by Trawalter, Todd, Baird, and Recheson in 2008 that was meant to study the negative attention that black men provoke simply for the way that they look (Trawalter, S., et al, 2008). The findings of this study were able to prove that the faces of black people are able to grab the attention of the study’s white participants as threatening. But this study’s interpretation of their results had been tied to an entirely different study done on the negative stigma on black people, and their degree of danger based on appearances (Correll, J. et al, 2006). The results show that the faces of black people had merely caught the participants’ reactions, not that they were seen as threatening.


Just think about all the times someone has caught your attention. Yes, there are bad ways to catch someone’s attention: if you were to see someone with a torn shirt, they would catch your attention. But if someone had worn an attractive outfit, they would also catch your attention. Not in the same ways, but you would look at them and glance them over.


Without the other study done by Correll, et al, the findings in the study done by Trawalter, et al, would have been inconclusive, rather than negative. It would have shown that the faces of black people caught the participants’ attention, without the researchers being able to have a clear identifier of the type of attention- good, bad, or neutral.


Now, there are two separate studies, one in 2008 and another in 2012, that show that there may be a possibility that implicit attitudes, a subconscious assumption about a person or thing, can predict attentional bias towards black faces (W. Finnegan, et al, 2018). But there are many problems with implicit measures of danger (implicit attitudes).


As shown by (W. Finnegan, et al, 2018), is that these- implicit attitudes- come from being around an influx of biased and stigmatized information and internalizing it subconsciously, and that they are often associated with conscious attitudes, which means to be aware of what you are absorbing rather than it being subconsciously ingrained. And not to mention that there is major uncertainty for whether the implicit attitude, that is subconsciously acquired, or the explicit attitude, that is acquired purposefully, that people have built will be what causes attentional bias towards the faces of other races.


Based on specifically these studies, the researchers found what they are looking for and how. This study will try to pick up the slack from the other studies to the best of its abilities. They examined the tendency for the perception that people may have in  comparison to the faces of both black and asian people. They took an SOA test which takes the amount of time of attentions from two different sets of stimuli. They took a close contact SOA and compared it to the short SOA taken by Dickter, et al, 2015. The researchers in this study expected to find that black faces would be rated as more threatening, compared to asian faces, for implicit and explicit measures.


The study included 41 participants of University age who were self-identified as White. These participants were given three things to do. First, they had to take an Implicit Association Test (IAC) twice. An IAC measures someones automatic connection of their mental thoughts of the subject when seen (Greenwald, Anthony G., et al (1998), 74 ). The first test had the faces of asian people and the second, faces of black people. Both tests were had 2 images of white people. They showed four different categories of images labeled, ‘white’ ‘black/asian (depending on the test)’ ‘threatening’ and ‘non threatening’. After the participants saw the images, they were to categorize the faces under a set of words: ‘Dangerous’ ‘sinister’ ‘frighten’ ‘intimidate’ ‘distress’ ‘harmless’ ‘safe’ ‘innocent’ ‘reliable’ ‘trustworthy’. (W. Finnegan, Steve, et al. 2018).


The participants also had to do a Dot- Probe Task that has been modified from other studies. This task was to give a reaction- timed response to determine to a series of slides. A white cross was shown first for 500 milliseconds, followed by a red line at a 45 degree angle for 200ms. It then shows either the face of a black person or asian person (depending on the test) either above or below a neutral oval for 100ms, followed by another angled line either in the same or in a different position for 2s and a response. In this test, the participants response would be slower when the angled line is at a different position the second time, because there would be a shift in focus when the face is shown. After all 80 faces were shown, the participants were to rate them on a 7-point scale for the thought of threat.


Finally, the participants had to complete a survey regarding their contact with other races. They were to list the initials of up to 20 friends, then, after they wrote all the initials, to note the race of each.


The findings of this study showed a multitude of positions. But ultimately, they showed that the white undergraduate participants found black faces more threatening than asian faces in implicit measures. It was seen in this study that explicit measures, the ones that are consciously brought about, can be self-censored by the individual, as there was a no correlation between the explicit and implicit measures between black faces yet there was between the asian faces.


Greenwald, Anthony G.; McGhee, Debbie E.; Schwartz, Jordan L.K. (1998), “Measuring Individual Differences in Implicit Cognition: The Implicit Association Test”, Journal of Personality and Social Psychology, 74


Al-Janabi, S., MacLeod, C., & Rhodes, G. (2012). Non-threatening other-race faces capture visual attention: Evidence from a dot-probe task. PloS one, 7(10), e46119


Correll, J., Urland, G. R., & Ito, T. A. (2006). Event-related potentials and the decision to shoot: The role of threat perception and cognitive control. Journal of Experimental Social Psychology, 42(1), 120-128


Dickter, C. L., Gagnon, K. T., Gyurowski, I. I., & Brewington, B. S. (2015). Close contact with racial outgroup members moderates attentional allocation towards outgroup versus ingroup faces. Group Processes and Intergroup Relations, 18(1), 76-88


W.Finnegan, Steve, et al. “Implicit Rather than Explicit Threat Predicts Attentional Bias towards Black but Not Asian Faces in a White Undergraduate Population.” Strathprints, Frankfurt School Verlag, 26 May 2018, strathprints.strath.ac.uk/64736/.


Trawalter, S., Todd, A. R., Baird, A. A., & Richeson, J. A. (2008). Attending to threat: Race-based patterns of selective attention. Journal of Experimental Social Psychology, 44(5), 1322-1327.

Climate change in Nevada

Major climate change perception surveys have been conducted in the U.S within the last 20 years polls found that 57% (2009) and 59% (2010) of Americans believed that global warming was occurring. Few studies have focused on rural American climate change perceptions. 

We will explore perceptions, knowledge and preferences regarding climate change in Nevada with people who have a personal connection to its local and sometime extreme environment. Surveys were made to the tribal groups located in Nevada to collect data about the tribal climate and risk perceptions. The tribal households were targeted through mail and house-to-house surveys distributed by a tribal member undergraduate researcher. Focusing on the tribes in Nevada gave them more insight of climate change in rural areas. The environmental managers (EM) survey response rate was 54%, they represent statewide tribal governmental perspectives, knowledge and action plans. The ranchers/farmers (RF) survey achieved a 26% response rate, which is solid for a survey-resistant group and lengthy survey.

The EM and RF have much in common in terms of education, both groups have major land and water management responsibilities. Differences in RF and PL (which is a Tribal group in Nevada) perspectives do no reflect major income disparities. Public opinion and risk perception regarding climate change are important in environmental policy and management modifications.  

PL and RF sources of climate change information are dominated by television, although RF also receives sources from the internet and radio, which is often conservative in rural Nevada. The fundamental question regarding whether or not climate change exists and if human play a role is affirmative by about 3/4 of PL respondents. While 100% of EM believe climate change. Only 60% of Nevada’s farmers and ranchers agree that climate change is happening, and about 29% believe that human activity is a significant role.

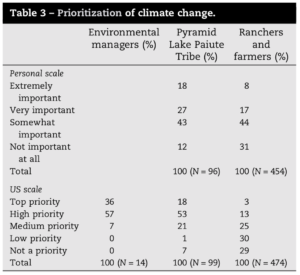
Prioritization of climate change.

Many Native Americans, like RF, spend most of their time on the land and water, which makes them valuable since they can observe the changes happening. The EM climate impacts observations are about 86% for decrease in snow packs and 79% earlier runoff. PL records three high marks in the same categories, and there are also same percentages for observing less surface water and less spring water. RF have lower percentages, close to half snow pack decreases, and a quarter of early melting and runoff, with the same for increasing temperatures in summer. However, they did find less surface water and less water from spring. 

Americans’ awareness of global warming or climate change has risen since the 1980s, however the rise has been uneven. Factors as gender, martial status, and education have a moderate effect on the individual scientific knowledge of climate change. A greater percentage of women than man believed that climate change is happening, and that it is because of human activity. In recent years belief in climate change has drop, in 2010 only 57% of American adults felt climate change was happening, compare to 71% in 2008. There hasn’t been a lot of discussion about this topic recently so this may have had contributed to a decrease in belief. 

This findings about climate change can be researched in a local level making it more meaningful and understandable to the public, even to those who are already decided this isn’t happening. This research proves a lot of  point from different groups of different opinions, climate change being the only one each group agrees is happening. The observations of each group or tribal gives us basically the same results just different rates of how it is happening.  

Climate Change Analysis in Rural Nevada

Earth’s climate has changed all throughout history. Climate change as we know it has been a controversial and arguable topic and its validity has always been under investigation. The amount of research done in the U.S. over climate change in the past two decades has grown immensely (Bord et al., 1998). Studies from the research showed that back in 2009, 57% of the U.S. population believed that Global Warming was occurring where as a year later in 2010 they found that the percentage has increased to 59% (Dietz et al.). While the percentage has only grown a little, the concern is only increasing. As humans inhabiting this earth, it is natural that those aware of climate change fear it because of the possible environmental deterioration it could cause. But exactly how much of climate change are all Americans aware of and truly understand ? Research was conducted in areas less affected by the problem, several of the studies conducted involved rural American perception, specifically in rural Nevada.

The groups primarily researched included ranchers and farmers who are non-Native American and three Native American groups: Summit Lake Paiute Tribe, Pyramid Lake Paiute Tribe and the environmental managers of tribes across Nevada. Information was obtained through fieldwork with all four groups. Several methods include interviews, surveys and videos.

Amongst these groups, several of them were surveyed for their beliefs regarding climate change. There were no reflection in income but differences between political views were noted (Chief et al., 102). The Pyramid Lake tribe consists of 52% democrats, 5% republicans and 24% no interest in politics. 73% of ranchers/farmers were republicans, 4% democrats, 10% independent and 2% other and no party (Chief et al., 102). The Pyramid Lake tribe believes that,

“it impacts my life and my family’s life in ways that we cannot measure, there are changes happening faster than expected,”

whereas ranchers and farmers believe that,

“there are many local changes due to land use changes. At larger scale, there are effects from sunspots, magnetic field strengthens seafloor and terrestrial volcanism; changes in h/t of earth axis among the factors that occurring cycles that sometimes overlap and strengthen their respective effects. No one yet explained very well the difference between variation and change across a suite of scales.”

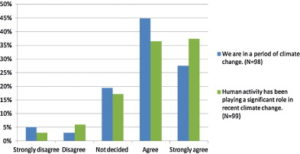
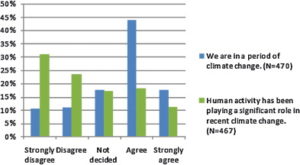
Both these groups acquire their information regarding climate change mainly from watching television. According to the collected data, the Pyramid Lake tribe and ranchers/farmers are both on the same page and approximately 45% of both groups agree that we are in a period of climate change. However, there is a drastic difference when both groups were surveyed whether or not they believe human activity played a significant role in recent climate change. A majority of the Pyramid Lake tribe either agreed or strongly agreed that recent climate change is caused by human activity but the majority of ranchers and farmers felt the opposite (Chief et al., 103).

Graph on the occurrence and origins of climate change for the Pyramid Lake Tribe

Pyramid Lake Tribe: Occurrence and origins of climate change

Graph on the occurrence and origins of climate change for ranchers and farmers

Ranchers/farmers: Occurrence and origins of climate change


As the data is reviewed, it shows that a greater percentage of women than men believe that climate change is happening (69% – 58%). More women than men also believe that climate change is occurring due to human activities (45% – 24%) (Chief et al., 107).

Since the 1980s, American’s awareness of “global warming” or “climate change” has grown unevenly. In 1989, 70% of Americans viewed climate change seriously and by 2003, rose to 92%. Another survey conducted in 2008 suggested that this percentage dipped to 71% and by 2010, about 57% of American adults felt climate change was happening.  As we better understand the importance of climate change nationally, we are able to explore and compare the differences with tribal groups. On a personal scale, 43.5% of the Pyramid Lake tribe and ranchers/farmers felt that climate change was somewhat important to them, but on a US scale these percentages easily differ. At least half of both environmental managers and the Pyramid Lake tribe felt that climate change is a high priority, contrastingly, the majority of ranchers/farmers felt that it is from a medium priority to not a priority at all (Chief et al., 108).

Surveys show that climate change ranks third in the list of key environmental problems according to environmental managers. From 2008 to 2010, decreasing from 34% to 25% of Americans thought they were being harmed with climate change. In fact up to 23% in 2010 thought we will never be harmed by it. But, the majority of tribal members surveyed were aware of climate change and agreed that human activity plays a significant role in it. 100% of environmental managers believe that impacts of climate change are occurring right now, but just half of the Pyramid Lake tribe believe it (51%). And, only 27% of ranchers/farmers believe they are being harmed by the effects of climate change (Chief et al., 109). An opinion shared by an environmental manager stated that,

“climate change has impacted the tribe because we do not have enough water for our plants and animals. If we don’t have these resources we don’t have anything.”

A member of the Pyramid Lake tribe felt similarly,

“Less water for our lake, vegetation in areas of the reservation have dried up, aquifers have dried up. I remember waist deep snow years ago. We are lucky to get ankle deep snow these days. Springs are no longer there on the reservation, less game available and less native medicines to gather.”

Unsimilarly, a rancher/farmer had a more optimistic and specific view sharing,

“Who is to say that it would not be beneficial? Longer growing season. Maybe it would snow more…and the water table would rise. Being taxed to death to pay to correct it and give money to developing countries… is what’s going to harm my family and business.”

The truth is as surveys prove, climate change planning is undeveloped or not developed at all (Chief et al., 110).

Survey results indicate relationships with knowledge, politics and gender. A significantly large percentage of conservative, republican, male and married ranchers/farmers believe that climate change would bring little to no harmful impacts. Gender on the other hand, had significantly negative results. Female ranchers/farmers were more concerned about adverse impacts. A recent study by McCright in 2010 proved that women demonstrate more scientifically accurate information and have greater climate change knowledge, more concern about environmental issues especially including health or safety risks. Another interesting outcome of the study showed that the Pyramid Lake tribe holds a greater value on the future generations that ranchers and farmers do (Chief et al., 114).

Although the ranchers and farmers hold the most different views out of all four groups, they also hold sensible opinions. A simple one being,

“If you can’t adapt, you don’t deserve to survive, change is inevitable.”

They also worry whether or not scientific research is done right and does not turn into an excuse from the government for potentially, higher taxations. Some statements from surveyed ranchers/farmers include,

“Climate change has become an industry, self-perpetuating with very little true science and a lot of money spent and collected to control lots of people’s lives”

and,

“I worry government or congress will enact rules and regulations using climate change as an excuse to change water & natural resources laws, expand trade laws & taxes” (Chief et al., 117).

When God’s name was included in the study, two different sides were taken by Native Americans and ranchers/farmers. Tribes often refer to God’s name when honoring what God made as they pray for and protect nature, whereas for many ranchers and farmers, God was their reason not to take action because it was “arrogant” to believe that one could interfere with his plan (Chief et al., 119).

The work conducted in this study provided information and knowledge on the different perceptions of climate change from voices, sometimes, less commonly heard. Comprehension on a local level brings meaning to the public. Public opinion and risk perception regarding climate change are also increasingly important in environmental policy and management modifications. Ramifications are taking place for similar populations in arid and semi-arid lands, particularly in the Southwest of America. Global climate change has caused noticeable and observable impacts in our environment.  Focusing on capacity building and collaborative research within tribes need to take place to better understand and responsibly act towards the concern of climate change (Chief et al., 117). 


Works Cited

Bord, Richard J., et al. “Public Perceptions of Global Warming: United States and International Perspectives.” Endangered Species Research, 17 Dec. 1998, www.int-res.com/abstracts/cr/v11/n1/p75-84/.

Dietz, T., et al. “Scopus Preview.” Scopus Preview – Scopus – Welcome to Scopus, www.scopus.com/record/display.uri?eid=2-s2.0-34250013893&origin=inward&txGid=53c8ed1de42f1a6b1eea3dd3b23879d3.

William James Smith Jr., Zhongwei Liu, Ahmad Saleh Safi, Karletta Chief. “Climate Change

Perception, Observation and Policy Support in Rural Nevada: A Comparative Analysis of Native Americans, Non-Native Ranchers and Farmers and Mainstream America.” NeuroImage, Academic Press, 5 July 2014, www.sciencedirect.com/science/article/pii/S1462901114000641.

A Melting Pot is All We Got: the U.S. and Immigration

What makes a person feel like an “American”? Is it baseball, apple pie, double cheeseburgers, or does it go deeper? This question is particularly important for immigrants to the United States. Once known as a melting pot of cultures, America’s immigration policy has been broadcasted to the world like never before and has polarized its citizens. Feeling “American” for immigrants is not just based on their view of themselves; it is heavily impacted by the treatment they receive from others and the expectations of the American public. This issue of feeling “American” has landed in the public eye and become a conversation topic in both social circles and academic ones. The article “Immigrant Perceptions of U.S.-Born Receptivity and the Shaping of American Identity” delves into what contributes to being “American”.

The article begins with describing different ascriptive characteristics–such as religion, ethnicity, or language– that influences an immigrant’s likelihood of naturalization or returning to their home country. To get a further view of what U.S.born individuals believe, the researchers reviewed past surveys that, “…asked respondents about what elements constitute being a ‘true’ American”. A general respect for the Constitution and laws in general were deemed important, but speaking the English language was too. Earlier work found that certain ethnic groups are perceived as more American, specifically European Americans. This result seems to suggest that, “… linking of American identity to a set of ascriptive characteristics privileging whiteness leads to an implicit (and sometimes explicit) ranking of the U.S. born over the foreign born, U.S. citizens over noncitizens, and European immigrants over their non-European counterparts” . The U.S. born may have trouble viewing immigrants as American if they lack the ideals the country’s inhabitants knowingly or unknowingly have: Christianity, whiteness, and ability to speak English. Recent immigrants that do not fit this mold may have trouble viewing themselves as truly American, along with the individuals facing discrimination. The legal status of immigrants holds a lot of power in being perceived as American, and the authors of the article found evidence that, “Undocumented immigrants, for example, are consistently viewed more negatively in public opinion polls than their legal counterparts”. Therefore, illegality can be counted as a negative characteristic on immigrants that adds to their hostile reception.

After reading studies similar to the one they were performing, the social scientists began their research. The article asserts that positive receptivity from the U.S. born plays a major role in whether an immigrant identifies themself as American, doubling as an offset to the possible clashing of ascriptive characteristics.  Studies on immigration focus on law and policy based on a general public feeling, rather than individual interaction, though the researchers commented, “This is surprising, as there is considerable evidence that individual-level contact—defined as face-to-face interactions between members of different groups—can meaningfully contribute to improving intergroup attitudes”. The research suggests that if immigrants perceive their interactions with the U.S. born as positive and welcoming, it increases their chances of feeling “American”.

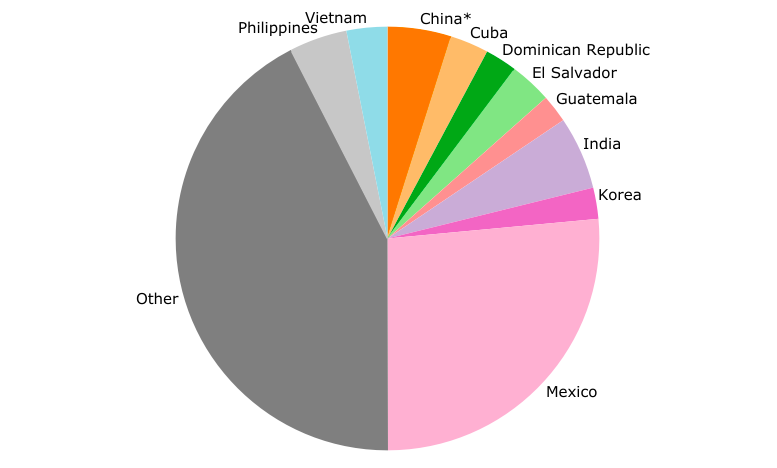
The researchers chose to study immigrants from Mexico and India in the metropolitan areas of Philadelphia, Pennsylvania, and Atlanta, Georgia. Mexicans and South Asian Indians are the largest group of immigrants in America, and represent stereotypically low status and high status groups, respectively, in terms of finances and the social atmosphere.

Top Ten Largest U.S. Immigrant Groups, 2016; The largest being "other", followed by Mexico and India, respectively.

Top Ten Largest U.S. Immigrant Groups, 2016

Both groups have exhibited ability to “pass” as other races in context of the United States and experience prejudice and discrimination while living in the country. Due to both groups being perceived very differently by the U.S. public, immigrants from Mexico and India made good comparison groups for the study. Philadelphia and Atlanta were chosen for their populations of white and black Americans, along with the presence of Mexican and Indian immigrants. The researchers performed a series of qualitative interviews with people born in the U.S. and foreign immigrants. The interviews focused on the ways immigrants from Mexico and India perceive barriers to being seen as American, especially by religion and language. The interviews showed that Indian immigrants, or the children of Indian immigrants, were not seen as American because of skin color. A U.S. born woman cited language as the main separator from American to outsider. The results of the survey suggested ethnicity and language had more of an impact on the public than the legality or religion of the immigrant. Some of the interviews show negative interpersonal interactions between immigrants and the U.S. Born. These negative interactions may contribute to immigrants’ reluctance to consider themselves “American”.

The findings of this study support what the researchers previously thought: ascriptive characteristics shape American identity. That being said, the article shows the importance of the concept of reception to immigrants. It states, “Sociologists of immigration have long argued that a receiving country’s ‘context of reception’ shapes new immigrants’ incorporation paths and identity formation”. This concept usually is not applied to the individual level, which this article deems important. The findings demonstrate how perceptions from one-on-one interactions are important into taking on the American identity, though ascriptive characteristics still affect the process. Immigrants that are darker-skinned or do not speak English statistically are less likely to think of themselves as American. Based on the findings, religion and legal status were not as polarizing as the language barrier.

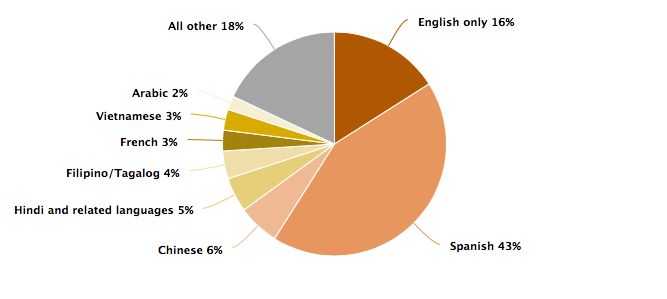
Percentages of languages spoken at home by immigrants; 43% Spanish, English 16%, Hindi and related languages 5%

Languages spoken among U.S. immigrants, 2016

South Asian Indian immigrants and Mexican immigrants gave more importance to different groups of U.S. natives and if they felt welcome by said groups. Indian immigrants searched for acceptance from white Americans, while Mexican immigrants looked for welcoming interactions from both white and black Americans. The researchers connect this to the socioeconomic status of both groups. Personal identification as American influences both groups of immigrants to become citizens and to stay in the U.S. Ascriptive characteristics are significant factors in immigrants’ identification as American, but so are interactions with locals. Positive conversations between immigrants and the U.S. born help both groups; immigrants in feeling welcome, and U.S. citizens in removing conscious and unconscious prejudices from their way of life.

A limitation to the study is the specific groups the researchers collected data on. Gathering information only on immigrants from Mexico and India fails to fully grasp the immigrant experience in the U.S., though each individual would have his or her own story. Only getting perspectives from two cities in the United States makes it difficult to hold the results over the entire country. The study relies on making generalizations about groups of people based on limited responses, which does not give a broad picture of immigrant perceptions in the U.S., it shows immigrant perceptions in Philadelphia and Atlanta.  

The United States used to be a place of refuge for immigrants escaping oppression. Now that oppression has bled through the U.S., immigrants and people seen as “different” from the white mold of an American face discrimination and hostility. Feeling welcome in the country they now live in assists immigrants to adopt the term “American”, but what does that mean? People can define being an American as whatever they want; the U.S. does not have an official language or religion, it is a place for everyone. Being an American does not have set characteristics, but more and more people see it that way.

This country has always been a country of immigrants, since the first people migrated from Asia across a land bridge. Throughout the United States’  history, each new immigrant group was hated by those born in the country. Most citizens now are the products of these past immigrants, and think of their ancestors in high esteem, while putting down the people who join the country now. Instead of judging immigrants because of their differences, celebrate what unites us all. Love of family, love of friends, and love of country help shape the United States. Being in this country should not put entire groups of people in fear. The ethnocentric view a lot of Americans have adopted is damaging to the country and to the people themselves. The culture the United States has today is not one dimensional; it is a map of where we have been. Enjoy the unique culture this melting pot has and treat everyone with dignity and respect. It is up to us to keep the local interactions positive and welcoming; make America a country of love, not hate.


Works Cited:

Jones-Correa, Michael, et al. “Immigrant Perceptions of U.S.-Born Receptivity and the Shaping of American Identity.” RSF: The Russell Sage Foundation Journal of the Social Sciences, 2018, pp. 47–80., doi:10.7758/RSF.2018.4.5.03.

Migration Policy Institute (MPI) tabulation of data from U.S. Census Bureau, 2010 and 2016 American Community Surveys (ACS), and 2000 Decennial Census; data for 1960 to 1990 are from Campbell J. Gibson and Emily Lennon, “Historical Census Statistics on the Foreign-Born Population of the United States: 1850 to 1990” (Working Paper No. 29, U.S. Census Bureau, Washington, DC, 1999).

Pew Research Center tabulations of the 2016 American Community Survey (IPUMS). “Languages Spoken among U.S. Immigrants, 2016.” Pewhispanic.org, PEW Research Center. 

Calling all College Students: How do you manage stress?

College is a busy time for all students, and it is easy to be overwhelmed by the workload given in many college classes. Recently, many college students report an increase in mental health issues, such as depression and anxiety. These mental health issues play a large role in how well students perform in their academics. However, research is being conducted to determine the best course of action. Researchers have conducted studies to evaluate how the best way to alleviate stress. In the study “Effectiveness of an Internet- and App-Based Intervention for College Students With Elevated Stress: Randomized Controlled Trial” 150 participants were tested. The results revealed there is a value in apps and Internet-based intervention methods.

College students can have intervention methods readily available.

Apps on cell phones are easy to access

In this case, the app that was studied in this case was StudiCare Stress. How the apps works is participants were asked to keep a daily journal. These journals were prompted with the questions: “How do you feel today? (Emoticons: Happy–Sad–Anxious–Angry), How stressed out do you feel today? (Rating scale 1-10), Describe what happened today. (Free text), Were you able to identify any things contributing to your stress levels today? (Free text), Are there any techniques you previously learned that you may be able to apply? (Free text), Do you want to add a photo to your entry? (Upload button)”(Harrer). Along these journals, participants could also complete daily modules that were specifically tailored to the needs of the participants. For example, if a participant was having issues with time management the app would offer lessons on how to plan for studying and homework that fits the individuals’ schedules.

The study found stress levels were moderately to largely reduced in the targeted age group of the study. Those who had mental illnesses, for instance, depression, also noticed a significant change in mental health. However, there was no noticeable change in the areas of self-compassion, perfectionism, resilience, and self-esteem. This particular study resulted in different data than previous studies (Harrer) For instance, more benefits to Internet-based interventions were found in this study. Benefits discovered in this study include the most effective way to reduce stress is to target perceived stress (Harrer). Perceived stress is defined in the Encyclopedia of Behavioral Medicine as “the feelings or thoughts that an individual has about how much stress they are under at a given point in time or over a given time period,”(Phillips). By targeting the individuals’ needs, participants reportedly stated to have less stress and a better mental state. This change in mental health could also lead to better performance in college classes, an investigation worth the study.

Given the above average rating by the participants, it can be concluded that internet-based apps are a successful intervention method.

Overall app rating by participants

One aspect of the interventions that was widely accepted among the participants what that of the mini-modules. These mini-modules targeted specific issues that college students may have. This allowed the participants to not only have a broad and overarching method of stress relief but also to have a specific intervention for their individual needs. One of the downfalls of the study, mentioned by several of the participants in the study, was that the modules were more of a time commitment than they were expecting or had time for. The modules being the daily logs in the Internet-based intervention methods. However, this raises the question of if the modules were any shorter, what would be lost from the overall effect of the interventions.

However, it is important to mention what this study was not capable of achieving.  One of the limitations of this study as noted by the authors is that there was not enough diversity in the participants. There was a noticeable disparity between male and female participants, with females being the majority of participants (Harrer). The study does not mention what race, ethnicity, or sexual orientation the participants with which the participants identify.

Another limitation of this study is that there was a three month follow up with participants to gather more data about the long-term effects of Internet-based interventions. This three month time lead to a large number of dropouts (Harrer). This means that there are gaps in the data collected, however, it was also found that the gaps are not a significant issue in the overall data analysis.

Another factor to keep in mind is that participants were not denied outside intervention methods, for instance seeking therapy. In this way, the effects of co-intervention with the Internet-based intervention and medical services could play a different role in how effective the Internet-based intervention methods are by themselves. One of the other limitations of the study was the way in which data was interpreted (Harrer). It is possible that participants over exaggerated the effectiveness of the Internet-based interventions.

Many college students do not seek help from mental health care providers for fear of being judged by peers. The fact that this intervention method was informal may have attracted participants. Future studies may want to explore how the way we frame mental health care and how to target those who may be adamant about not receiving due to the aforementioned reasons.

The study concludes that internet and mobile-based interventions are effective. They are widely accessible and easy to use a form of reducing stress in college. As an added bonus, the cost of utilizing these methods are very cheap, which may attract more participants (Harrer). The stigma mental illness receives in media may be what makes people hesitant to receive the care they need. It would be beneficial for future studies to examine how professional help and internet-based intervention work together or oppose each other. Another future study should examine the effects of personalized care in Internet-based interventions, and how more or less effective it would be.

If college students feel stressed and need a way to channel that stress, they should try an internet-based intervention. It has been shown in this study to be effective, accessible, and budget-friendly. If students are not already receiving professional medical care, apps similar to StudiCare Stress could be a benefit. Given that stress levels were reduced in this study, it seems likely that Internet-based and app intervention techniques are helpful more than harmful. Students should strongly consider using them as a resource if they do not wish to seek professional help.


Citation:

Harrer, Mathias et al. “Effectiveness of an Internet- and App-Based Intervention for College Students With Elevated Stress: Randomized Controlled Trial.” Ed. Gunther Eysenbach. Journal of Medical Internet Research 20.4 (2018): e136. PMC. Web. 4 Oct. 2018.

Phillips A.C. (2013) Perceived Stress. In: Gellman M.D., Turner J.R. (eds) Encyclopedia of Behavioral Medicine. Springer, New York, NY

The Lost Identity of Immigrants in America

When people are leaving their country because of safety reasons, they should be comforted in the US where they do not have to deal with these problems. Instead, they are made into outcasts. Because of this feeling of exclusion, some immigrants have tried to Americanize themselves to become more like the norm. This is not what should be happening. Rather, we should be accepting of our differences and embracing them. People living in the United States need to understand that immigrants coming into this country struggle with making a living. But, they is another side to this argument: the fear of Americans to accept immigrants because of the danger they could inflict. With the history of the U.S. including the bombing of the World Trade Center, the Boston Marathon bombing, and many more, Americans fear immigrants. Also, some US citizens do not like immigrants coming into their country because they could take the jobs that they want.  In the article, “Immigrant Perceptions of U.S.- Born Receptivity and the Shaping of American Identity,” <https://www.rsfjournal.org/doi/pdf/10.7758/RSF.2018.4.5.03.> The authors research how immigrants feel less American because of certain characteristics such as language and race

Surveys and interviews were conducted to reveal the feelings of these immigrants. This study was inspired by the concept of what American Identity is composed of. The authors of the article describe American identity as the beliefs of “individualism, hard work, freedom, equality, and the rule of law,” but also by characteristics such as, “language, skin color, native birth, and religion” (Jones-­Correa et al. 1). Researchers were looking for results that reveal how race and language impact immigrants’ feeling of exclusion in American society. They performed this test through numerous surveys. South Asian Indian immigrants and Mexican immigrants completed the surveys and were asked how their identification as Americans impacts their decisions within their communities and in the nation (52).  In the interviews, immigrants were asked how their race affects their identity as an American (56). They concluded that characteristics do indeed impact immigrants’ views on their own identification and reveal their feelings of being marginalized because of these characteristics (65).

This study was done using many surveys and interviews and in specific locations and immigrant groups to retrieve their results. They surveyed immigrants in Atlanta and Philadelphia. They studied in these two metropolitan areas because the places have large amounts of naive blacks and whites along with many immigrants from India and Mexico (54). They studied Mexican and South Asian Indian immigrants. The first reason they choose these two groups is that they are the two biggest groups in the US. Secondly, Mexicans have a lower status and Southern Asian Indians have a higher status. Lastly, Mexicans are the most affected by undocumented citizenship and Indians identity is mistaken for many other races like Muslim, Arabic, Mexican, or Native American (52-53).

Legal status of foreign born immigrants in the US

This graph displays the legal status of immigrants in the US, which depicts that 30% of foreign-born citizens have permanent legal residency and 26 % of immigrants are undocumented.

http://www.latinamericanstudies.org/immigration/chart-2002.gif

In this study, they conducted interviews via phone with about 500 people per group. The requirements to be eligible for an interview were that one has to be 18 years or older and must live in either Atlanta or Philadelphia. They were asked about their age, race, where they live, if they are employed, and how much education they have received. Although all these questions are valuable to the study, the most important question was, “In general, how strongly do you think of yourself as American?” (55).

Through this study, they found that specifically race and language impact an individual’s identity in America and these specific aspects impact his/her decision to return home. In an interview with an Indian immigrant man, the interviewer asked where the man and his parents originated and he responded with distress. He wondered why he was being asked because since he lives in the US, why would he be categorized as something other than American.

He was, then, asked if he thought it was because of his skin color and he states, “…if I’m not American, what am I? Because I have grown up thinking I am American. And all of a sudden, I feel like I’m being surrounded by people that don’t think that” (56).

His response accurately portrays the feelings of immigrants in America because even if they have been living in America their whole life or just a short amount of time, they are still Americans. Because of their race or language or whatever it may be, they are looked at as outcasts or someone who does not belong. Another example of this marginalization is from an Indian immigrant mother, who was angry at a comment a boy made to her son. While playing ball, a boy her son’s age said, “I don’t like you all people here you should go back to your country” (57). This boy was born in the US but is not treated as an American because of his race.

There were many limitations within this study. First, they only surveyed two immigrant groups in two places. This will result in a stereotype for all immigrants. To conclude that race, language, and other characteristics determine an immigrants identity in America, they should study all groups around America to eliminate bias and error.

After reading this article, my understanding of the struggles of immigrants has increased tremendously. My eyes have been opened to now seeing how Americans treat immigrants and how this treatment makes them feel excluded. Americans have marginalized immigrants so much so that they have tried to become more Americanized, which aggravated me to hear. No one should have to change who they are because of what others think of them. Also, people should not be making another uncomfortable and lonely to the point to where the person feeling different wants to change to be more like the norm. We, as a country, need to make a change to make all feel at home and comfortable with who they are and where they come from.

Flags from around the world

Flags from all around the world make up one large flag to symbolize the human race as a whole working together to better the world.

http://i.cdn.turner.com/cnn/2011/POLITICS/08/26/deportation.policy/t1larg.immigrationflags.gi.jpg

Jones-Correa, Michael, et al. “Immigrant Perceptions of U.S.-Born Receptivity and the Shaping of American Identity.” RSF: The Russell Sage Foundation Journal of The Social Sciences. p. 48-80.

Sex and Violence- Do I Have Your Attention Now?

man watching tv

a man watching nothing on tv, but I’m sure he’s enjoying it

“Do sell and violence sell?  A Meta-Analytic Review of the Effects of Sexual and Violent Media and Ad Content on Memory, Attitudes, and Buying Intentions” addresses the subject of sex and violence in media and ads, mostly speaking to those who assume that sex and violence sell. It begins with a joke, which I found refreshing, as I was about to delve into some really great statistics. It starts out by telling of the sex and violence in movies, TV, and video games. The researchers were interested if the use of sexual and violent media was justified. Robert Lull and Brad Bushman, authors of the article stated that “the simplest answer to this question is that advertisers think sex and violence sell, so they buy advertising time during sexual and violent programs, and in turn producers continue to create sexual and violent programs that attract advertising revenue.” Essentially, the TV networks work as delivery people for advertisers, sending consumers to them. Advertisers believe that sex and violence sell, which we will soon learn that there is some accuracy to that statement.

According to the article, half of media now contains violence, and a more than a quarter contains sex. This means that more exposure for the advertisers. According to the article as well, the age group most drawn to violent and sexual media is 18 to 34-year-olds, whose purchasing habits aren’t as set in stone as older adults, therefore the advertisers prefer to advertise towards that content. To put it simply, “violent and sexual media appeal to a key marketing demographic in addition to drawing large audiences.”

While larger events, such as the Super Bowl, do tend to accommodate larger audiences, and have more advertising, they do not necessarily cause higher buying intentions. Likewise, with the Olympics in 2002, advertising effectiveness actually decreased. It goes on to say, that while sexual and violent programs can have bigger audiences, it doesn’t necessarily mean that advertising effectiveness will increase.

“Studies across film, television, and video games suggest that advertising in violent or sexual programs and advertising with violent or sexual advertisements are both ineffective marketing strategies. Outcomes of these strategies include impaired memory for brands advertised during violent and/or sexual television programs, less favorable attitudes towards brands advertised in violent video games, and even declines in stock performance for brands placed in violent films.”

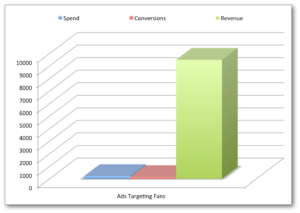
a graph

A graph showing the revenue brought in by ads.

This essentially boils down to violence impairs the memories of viewers.

They also wanted to delve into the buying intentions. There are eight steps in processing advertising: exposure, pay attention to it, comprehending, evaluating, encoding, retrieving, deciding, and buying or not buying. The second stage, paying attention, is possibly the most important because it directly correlates to advert effectiveness.

The study goes on to point out that the reason people enjoy violent and sexual media is because it relates to the primal notion of survival and reproduction. It is natural to relate to things that meet our primal standards.

“Based on evolutionary theory, we propose that people are hard-wired to pay attention to violent and sexual cues. Proponents of evolutionary theory argue that attention is selective because the mind evolved from an environment in which particular attention to potential threats to safety and potential opportunities for mating afforded survival and reproduction advantages. Our evolutionary ancestors that paid attention to violent cues were less likely to be killed by enemies or predators. Our evolutionary ancestors that paid attention to sexual cues were more likely to reproduce.”

This essentially means that those who took the cues were more likely to survive/reproduce.

To draw conclusions, there are a lot of effects on advertising. The way that sexual and violent medias are used are not necessarily effective, and can often blind consumers to the advertisements that they are seeing. This means that while sexual and violent media attract more attention, it doesn’t really help advertisers. Thusly, sexual and violent media is not useless, but rather redundant. This also correlated to the age of ads. As people have gotten used to sexual and violent ads or media, they become desensitized, thus making them forget the ads even more. Age, gender, and boundary conditions also affected buying memory as well. All in all, sexual and violent content in media does not necessarily serve as a viable helper for advertisers. It is a slippery slope trying to find the balance between good and bad.

Fact vs. Fiction: Are Students Reading?

By Abigail Stoff

As a future librarian, I am very interested in the reading habits of students. People have told me and friends of mine “if only you read more …” fill in the blank. Julie Gilbert and Barbara Fister, librarians at Gustavus Adolphus College in southern Minnesota, were just as interested as I am to know why people believe reading is going extinct with young people and whether or not that belief is true. To try and answer that question, Gilbert and Fister gave surveys to students, academic librarians, and a small number of writing instructors. These librarians and professors were asked about the recreational reading habits of their students and students were asked about their own reading habits. More specifically all participants (including students) were asked how often students read, what they read, and how much they would like to read. Gilbert and Fister found that reading is not voluntarily going extinct. According to their surveys, students enjoy reading for fun; however, they don’t have much time for recreational reading due to the readings and homework they are required to do for class (Gilbert 490).  


Gustavus Adolphus College located in Saint Peter, Minnesota.


The survey was conducted at Gustavus college. Students were asked whether or not they enjoy reading (nonfiction or fiction) for fun. Although responses varied across majors, gender, and genre, 93% of overall responding students said that they like recreational reading (Gilbert 478). The results indicate that women are only slightly more likely to enjoy recreational reading than men, which contradicts past findings, such as in Michael W. Smith and and Jeffery D. Wilhelm’s book “Reading Don’t Fix No Chevys”: Literacy in the Lives of Young Men (Gilbert 478). Though there were little differences between gender, there were larger differences between majors. Some students in a particular major reported a much stronger liking for recreational reading, such as the humanities major (99.0%). Some, however, did not like recreational reading as much, such as the pre professional majors. Students were also asked what genres they preferred to read. The favorite genre of students, by far, was general fiction (76.9%) followed by mystery (38.9%) and classics (33.7%) (Gilbert 479). These results, again, varied greatly between gender and major. For example, men are two times more likely than women to read science fiction and natural science majors are “over three times more likely to read science fiction than preprofessional majors” (Gilbert, 479). Plenty of students also like to read magazines, newspapers, and online publications. Just like with genre, the amount of recreational reading done by students varies slightly between majors.

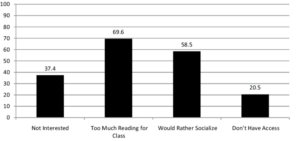
Student responses as to why they don’t read recreationally.

While many students reported that they do enjoy reading recreationally, they also reported that they don’t have much time to read what they would like. Much of their time is spent doing assignments for class. As well ask asking students questions about their reading habits, Gilbert and Fister also asked academic librarians across the nation. When asked how often students come to the library to find recreational reading material, the majority of librarians (61.0%) responded that students only occasionally look for recreational reading material in the library (Gilbert, 481). There are many reasons why students don’t or can’t read recreationally, the main reason, with 77.1% of student respondents agreeing, being that they “already have enough reading for class”. Other reasons being that students “would rather socialize” (35.7%), “would rather spend time in other ways” (31.2%), “don’t enjoy it” (3.3%), or “don’t have access” (3.3%) (Gilbert, 482). As usual, the differences arise mostly between majors. Humanities and fine arts majors report less often that they already have too much classwork. Only 19% of humanities majors report that they would rather socialize compared to the other majors who report in the upper 30%s. Librarians answered similarly, saying most often that students are too busy with other classwork to read recreationally. Another obstacle occurs when libraries don’t have the materials students want to read or the budget to order books for fun. The librarians were also asked whether or not they believe academic libraries should even contain recreational reading materials. Some librarians were of the opinion that academic libraries are “academic” for a reason and that they should only house material related to the curriculum or have only a small number of recreational reading material. Others support having recreational reading sections of their library because of the student demand. Students at Gustavus were asked what the library could do better to get students engaged in recreational reading. The top two options were book lists (60.2%) and an increase in the collection of recreational reading materials (40.5%) (Gilbert, 484).

Folke Bernadotte library at Gustavus Adolphus College.

Since this study was conducted, Gilbert and Fister have made some significant changes to the Gustavus Adolphus college library. Lists of recommended reading lists were made accessible to students in the form of bookmarks and a website will be launched which includes the lists and directions on where to find these materials. The Gustavus library’s circulation policy was also changed so students could take materials home during long breaks after it was found that students read more often during breaks from school. A fiction section that included all of the new book recommendations was also created in a new reading room to promote reading for fun (Gilbert, 489). The library plans on keeping this new section open for another year and advertising it further and getting student feedback. As well as new fiction books, they have also included magazines into their circulation system so students can now check out magazines. The library is also now offering a reading discussion class for partial credit. The library looks forward to seeing the effectiveness of their efforts on student reading habits.

Though the study’s findings are impressive, there are some issues with the study that the authors do not address. The majority of the study was conducted at only one small college. The results would be more valid if the study was broadened to multiple colleges. Having a small sample size could more easily skew results than having a large sample size. The survey was also written by the academic librarians at Gustavus. The librarians, biased as to what results they want, could have unconsciously worded the survey to sway respondents to answer in a particular way. Even the fact that the student survey was given to students by librarians could sway the students to respond how they think the librarians want them to respond. In order to avoid this, the survey should have been given to students from a neutral third party. The survey given to professors was only given to english professors and not professors of any other subject. English professors could be biased toward the reading habits of college students, which again, could skew results. The survey should have been given to professors of all subjects, not just English professors. This would give a more diverse, and therefore more valid, answer to what professors think of student reading habits.

This study has found that reading among students is, in fact, not going extinct. The previous studies that have concluded that young people don’t read also don’t take into account required class reading that students do. When we take required reading out of the equation, it is easy to see why those studies would believe that students don’t read. It is because students don’t have time to read anything other than required reading. However, this study proves that students do enjoy reading and would read voluntarily when they have the time and when they are interested in the material.

A look into the effects of mobile games that encourage physical activity

Jack Tigner

Professor Dave Leaton

Eng 190

1 October 2018

           A look into the effects of mobile games that encourage physical activity

    Everybody wants to be healthy. While some people take it more seriously than others, it is common knowledge that being healthy is better than not being healthy. However, we don’t always act on this knowledge, and as reported by Gabrielle Levy, a political reporter for US News, “Almost 4 in 10 American adults over the age of 20 – 39.6 percent – were considered obese in 2015 and 2016, a sharp increase over the 33.7 percent who were obese in 2007 and 2008.” But if a popular activity that usually induces a sedentary lifestyle can actually do the opposite, then maybe this problem can go away.

    Pokemon Go is a mobile game that released on July 6, 2016. It is a mobile game that involves a gps and internet connection where the player walks around in real life to find virtual monsters in an Augmented Reality, or AR, format. This obviously encourages the player to walk around a lot, to find more and more monsters and complete objectives. There are also direct incentives to walk around. This is also the first Pokemon game of this nature to appear on something other than a Nintendo specific game console. One other major draw to the game is the social aspect of it. There are three different teams that players sign up to join when they reach a certain level. After they sign on, they are able to fight in gyms, where players put their best monsters to defend. One can fight the gyms of other teams, and put their own monsters in gyms that are controlled by their team of choice. Also, since monsters spawn in different locations of the map for only a limited amount of time, catching the rarest of the monsters can be aided if one has friends that are also on the hunt. Additionally, there is a trading system in the game, where one player can trade monsters with another player, using some resources and with some restrictions. Doing this, and giving gifts to each other, which you get by finding them throughout the world, will increase your friendship level with that other player. When certain milestones are hit in friendship level, there will be unique rewards, like requiring less resources to trade, and getting more chances to catch when successfully completing raids together. A raid is a limited time event taking place at gyms where up to twenty players work together to defeat a single, strong monster in battle. If successful, the players have some chances to catch the monster. The damage their team did to the monster compared to the other teams, plus the friendship bonus if applicable, determines how many chances the player gets to capture the monster. These factors, plus even more, led to “45 million daily users shortly after launch” (Turk).

    So, as no surprise to anyone, people were curious just how much this game actually increased the physical activity of players. So, Oriol Marquet, Claudia Alberico, and Aaron J. Hipp of the Department of Parks, Recreation, and Tourism Management and Center for Geospatial Analytics, North Carolina State University decided to do a study. They wanted to see just how much effect the game had, and they wanted to provide that information not only to the public, but to other researchers and other app developers. Eventually, in late December of 2017, they finalized and published the results.

    The study consisted of 74 US college students who were asked to fill out some pre and post tests regarding their physical activity. Additionally, they were asked to install two apps on their phone, an Ecological Momentary Assessment, or EMA, and a step counter to further help the collection and support the accuracy of the data that the researchers would use to analyze the effects of Pokemon Go. The step counter would, obviously, count the steps of the user, so the researchers could compare the numbers with the other participants. The EMA would prompt a small questionnaire at 3 different times per day (12pm, 7pm, and 10pm), and the answers to these questions would help to determine the physical activity of the participant. The data showed that people who play Pokemon Go had:

higher PA when playing occurred during weekdays and during daytime and also among

those who played while being active (i.e., walking). During weekends, this association

was only found in the morning or late in the evening (after 7pm). Accumulating three or

more active playing episodes per day was associated with an increase of 1526 daily steps. (Marquet, Oriol, et al. 1)

    So, it appears then that this means that physical activity really is increased by playing, right? Wrong. This only mentions “Higher PA when playing” and nothing else. In fact, the results section of the report states that there is actually a non-significant effect on physical activity based on playing Pokemon Go. The only correlation that could be found was between actual playtime and the number of steps taken. This of course only applies to people who play the game. Even when the results were controlled by phone operating system, ethnicity, and gender, the playing still had no significant effect. dhs fhs fhddh dhf dhdfh dhfhd dhfhd dhfh dh

    This study has many implications. One of which is the continuation of the notion that video games promote a sedentary lifestyle. Even when the game must be played by walking around, the overall physical activity of the players is still lower than that of non-players. This is disheartening, because if there could be a way for video games to effectively improve the physical activity done by players, then it could have a serious impact on the health of not only Americans, but people around the globe. Additionally, there were a few limitations with the study had. Firstly, the study only had a sample size of 74 students, a relatively small group out of the approximately 45 million players in total. Secondly, it is possible that college students are a demographic that either generally has lower levels of physical activity, or maybe they aren’t the target demographic for the game.

So, when a video game forces people to go out in the real world, walk around hunting virtual monsters, and interact with other real people, does that lead to a higher level of physical activity? While this one study may have found an answer to that question, others may take the methods, the flaws, and the findings of it to create a better study and find a completely different answer to this question. Maybe if the game were to continue to release new content and more incentives to play more often and in new ways, it could revolutionize not only the mobile gaming market, but the health of people all around the world.


                    Works Cited

Levy, Gabrielle. “Sharp Increase in Obesity Rates, Over Last Decade, Federal Data Show.” US

News, 26 Mar. 2018.

Marquet, Oriol, et al. “Pokémon GO and Physical Activity among College Students. A Study

Using Ecological Momentary Assessment.” Computers in Human Behavior, vol. 81, 2018, pp. 215–222., doi:10.1016/j.chb.2017.12.028.

Turk, Victoria. “One Year on, Who Still Plays Pokémon Go?” WIRED, WIRED UK, 6 July

2017, www.wired.co.uk/article/pokemon-go-first-anniversary-who-still-plays.